Measuring Blockchain Economies: Introducing Gross Chain Product
Measuring Blockchain Economies: Introducing Gross Chain Product
May 7, 2026 / By Eric Lu / 14 Minute Read
The Avalanche Foundation proposes Gross Chain Product as a framework for measuring real economic output across blockchain ecosystems while separating changes in onchain activity from token price volatility.
Measuring Blockchain Economies: Introducing Gross Chain Product
At the Avalanche Foundation, evolving how we support the ecosystem means getting more precise about what we are actually measuring.
You cannot allocate resources effectively, evaluate programs rigorously, or design better protocol mechanics without a clear picture of the underlying economy you are trying to develop. That requires better data and better frameworks, not just better intentions.
This article introduces one such framework: Gross Chain Product, or GCP.
It is an economy-wide output metric for blockchain ecosystems, built on the same methodological foundations as national Gross Domestic Product (GDP) accounting. We develop it here for Avalanche's C-Chain, but the approach generalizes to the whole Avalanche ecosystem including Layer 1s (L1s) with sufficient on-chain data, and other chains beyond.
We cover three things in sequence. First, why the metrics the industry currently relies on are insufficient and what a rigorous alternative looks like conceptually. Second, how GCP is actually constructed: the income approach, the Fisher chain-weighting methodology, and what the measure captures that existing metrics do not. Third, what the data shows when you apply it to
Avalanche's C-Chain from January 2025 through March 2026, and what it reveals about the current state and structure of the ecosystem.
Part 1: Why Blockchain Economies Need a Better Measure
Blockchain ecosystems generate billions in economic activity, yet we lack a rigorous way to measure their total economic output. The metrics most commonly used each capture something real, but none of them answers the question we actually want to answer: how much genuine economic value is being created on-chain, and is that number growing or contracting?
Total Value Locked measures capital stock, not productive activity, some of which is idle. Token market cap reflects sentiment and speculation as much as fundamentals, and its fluctuations can tell you more about macro risk appetite than about what is happening on-chain. Protocol-level revenue tells one protocol's story but does not aggregate into an economy-wide picture. None of these is wrong exactly. They are measuring pieces that in isolation tell an incomplete story.
In traditional economics, we solved this problem decades ago. GDP measures the total value added by all economic agents in a national economy. It gives policymakers, investors, and researchers a single, methodologically sound number to track whether an economy is growing or contracting and by how much. It is not a perfect measure, but it is a principled one, and it has proven robust enough to anchor economic policy and research for nearly a century.
GCP applies that same rigor to blockchain economies. Starting with Avalanche's C-Chain, we define and compute an economy-wide output metric that aggregates the value creation of every protocol on the chain.
And just as GDP comes in nominal and real flavors, so does GCP. Nominal GCP values output at current token prices. Real GCP strips out token price changes to isolate genuine changes in economic activity. This distinction matters enormously in crypto, where token prices can swing 50-80% in a quarter. Without a real measure, you cannot tell whether a revenue decline reflects a genuine slowdown in on-chain activity or simply the mechanical effect of the denominating token losing value. That is not a technical nicety. It is the difference between measuring the economy and measuring the market.
Part 2: How GCP Is Constructed
The Income Approach: Measuring Value Creation
GCP borrows the income approach from national accounting. In GDP accounting, the income approach sums all income earned in the production process: wages, profits, rents, interest. The insight is that every dollar of output is simultaneously a dollar of income to someone.
On-chain, the analog works like this. Every protocol interaction generates value flows that we can observe directly from blockchain data:
Protocol Revenue - total fees users pay to use a protocol (swap fees, borrow interest, liquidation penalties, mint fees, etc.)
Protocol Onchain Expense - the portion of revenue paid to supply-side participants (oracles, incentives, etc.)
Protocol Onchain Profit - revenue minus expenses
Transaction Fees - gas fees users pay to execute protocol interactions on the C-Chain
A protocol's Value Added - its contribution to GCP - equals its onchain profit plus the transaction fees it generates:
Value Added = Onchain Profit + Transaction Fees
This is directly analogous to how a firm's value added in GDP accounting equals its profits plus wages paid. Summing value added across all protocols gives us economy-wide GCP.
We extract these flows directly from on-chain data: decoded smart contract events, ERC-20 transfers, and gas traces. Each flow is recorded at the token level - we know not just that Aave generated $X in revenue, but that it generated Y units of USDC in borrow interest plus Z units of WAVAX in liquidation fees, each with their market price at the time of the transaction. This token-level granularity is what makes real GCP computation possible.
From Nominal to Real: Fisher Chain-Weighting
Computing nominal GCP is conceptually straightforward: sum all value flows at their market prices on the day they occurred. Converting nominal to real is harder. It requires solving a problem that national income accountants have spent a century on: how do you create a constant-price output index when the economy transacts in hundreds of tokens with different and volatile prices?
The answer, used by the U.S. Bureau of Economic Analysis for real GDP since 1996, is the Fisher chain-weighted index. The intuition is as follows. To measure real growth between two periods, you need to hold prices constant and observe only quantity changes. But which prices do you hold constant - last period or this period?
Using last period's prices (the Laspeyres approach) tends to overstate growth because it does not account for substitution toward relatively cheaper tokens. Using this period's prices (the Paasche approach) tends to understate growth for the opposite reason. The Fisher index resolves this by taking the geometric mean of both:
Fisher Growth = sqrt(Laspeyres Growth x Paasche Growth)
This produces a symmetric, unbiased measure of real quantity growth. We compute it for each consecutive period pair, then chain-link the growth factors into a cumulative index anchored at 100 in January 2025.
For each of the roughly 700 tokens that flow through the C-Chain ecosystem, we observe both quantities and prices in each period. The Fisher formula combines all of these into a single growth factor that correctly accounts for composition changes, new tokens entering the economy, and dormant tokens dropping out.
We also decompose economy-wide real growth into protocol-level contributions using Tornqvist weights - the average of each protocol's nominal share in the current and prior period - allowing us to identify exactly which protocols drove aggregate growth or decline.
Part 3: What the Data Shows
January 2025 to March 2026
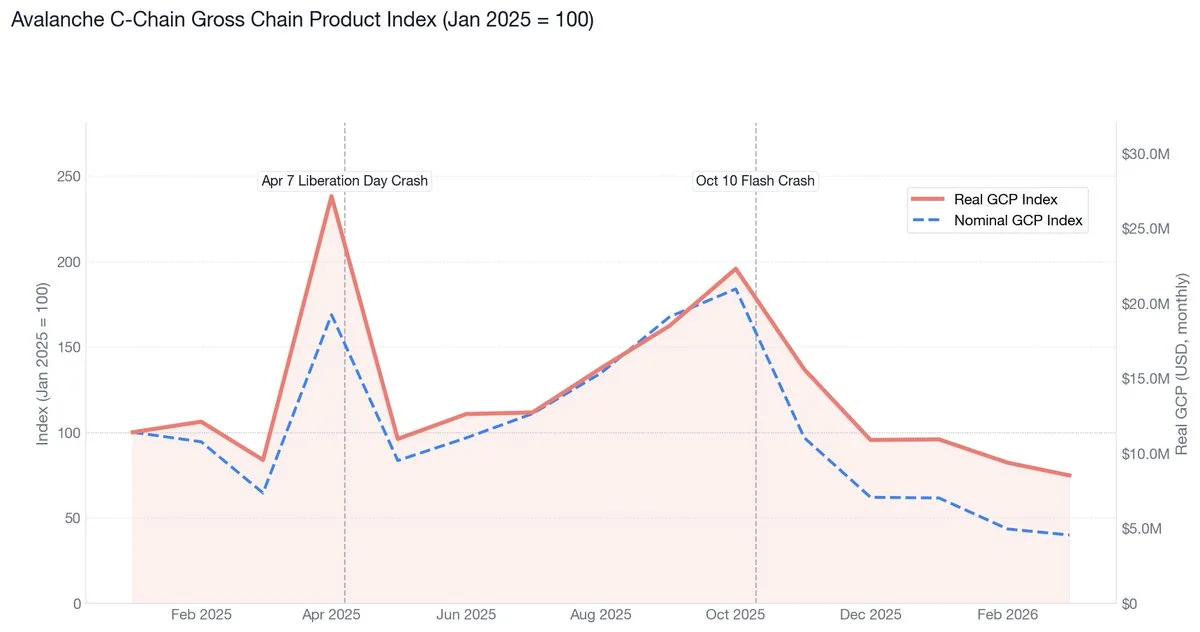
GCP Article Asset 01 - January 2025 to March 2026 Graph
Nominal (blue, dashed) and Real (pink) GCP indices anchored to January 2025 = 100. Both major spikes correspond to crypto-wide flash crashes that triggered liquidation cascades on Avalanche.
Reading the nominal and real indices side by side, the period since the January 2025 base breaks cleanly into three phases.
Phase 1 - Jan 2025 to early April 2025: soft start, then a tariff shock.
The ecosystem opened 2025 at its base level, drifted sideways in February (real index at 106), and softened modestly in March (real 84) alongside a broader crypto market pullback. Then on April 2, the U.S. administration announced sweeping "Liberation Day" tariffs. Over the following five days Bitcoin fell from $88,500 to $74,500, a 15%+ decline in under a week. On April 7 alone, a single day of liquidation fees on GMX V1 perps (denominated in BTC.b) generated over $13M in revenue on Avalanche - more than the chain's entire monthly GCP in most periods. Real GCP for April mechanically jumped to 238. Both series are telling the same story: a one-off liquidation cascade inflated the month, not a broad expansion in underlying activity.
Phase 2 - May to October 2025: steady rebuild.
Once the April spike unwound, activity reset near the base (real 96 in May) and then climbed steadily: 111 in June, 137 in August, 162 in September, and 196 in October. Nominal GCP tracked real closely through this phase, rising from $9.5M to a peak of . This was the cleanest stretch of growth in the series - broad DeFi activity expanding under a stable macro backdrop, without any single protocol or event distorting the aggregate.
Phase 3 - After October 2025: flash crash and persistent contraction.
A second macro shock in October drove a sharp decline in collateral values, triggering liquidations across lending protocols and shrinking borrowing capacity and trading volumes in turn. Real GCP fell 30% in November alone, to 137, then to 96 in December and 82 in February 2026.
The Nominal-Real Divergence
GCP Article Asset 02 - The Nominal-Real Divergence
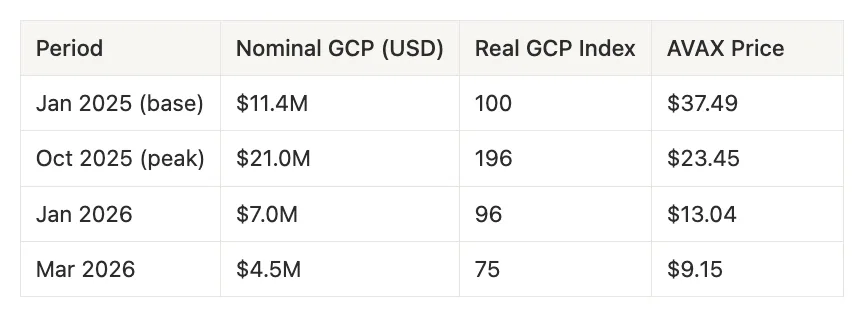
The comparison between nominal and real GCP reveals exactly what the Fisher methodology is designed to show.
Nominal GCP fell faster than real throughout this phase, reflecting the deepening token price drag on dollar-denominated output while real activity proved more resilient. By March 2026, nominal GCP was down 60% from the January 2025 base, while the real GCP index stood at 75 - down only 25%. The gap between the two is the portion of the nominal drop that reflects falling token values rather than reduced real activity. The Avalanche C-Chain economy was still producing three-quarters of the real output it generated at the start of 2025, even though the nominal figure implies a far more severe contraction.
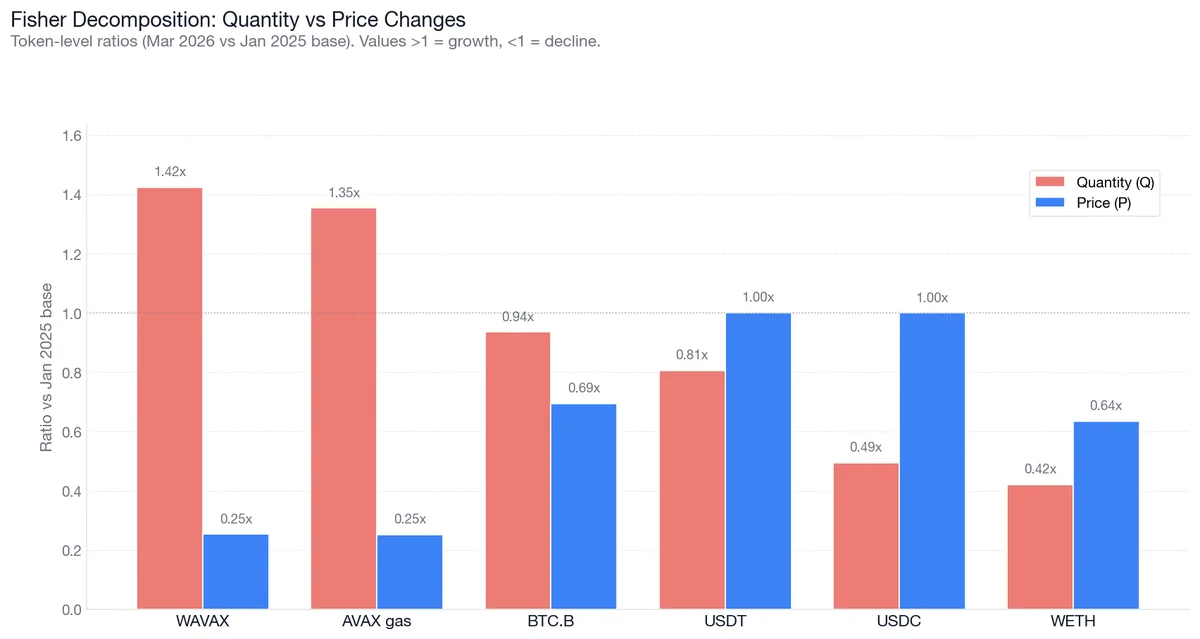
GCP Article Asset 03 - Fisher Decomposition
Fisher decomposition: quantity (pink) and price (blue) ratios for key tokens, March 2026 vs January 2025 base. Tokens are sorted by quantity change.
The Fisher Index in Action
The token-level decomposition makes the methodology's value concrete.
WAVAX and AVAX gas show quantity increases of 42% and 35% respectively, even as the token's dollar price fell substantially. More AVAX is flowing through protocols and being consumed as gas than in the base period. The Fisher index correctly sees this as real growth.
Stablecoins provide the cleanest signal because their price is constant at approximately $1.00. USDT quantity is down 19%, USDC down 51%. These are pure measures of reduced stablecoin lending and trading activity with zero price contamination.
Bridged assets (i.e., WETH.e, BTC.b) show both quantity and price declines in GCP flows, but the stock side of the story differs. C-Chain stock of BTC.b contracted meaningfully over the period, but its flows through protocols held roughly steady, implying higher velocity: the BTC.b that stayed on Avalanche is being used more intensively. WETH.e flow contracted by more than its stock, indicating lower velocity: it is sitting more idle than before.
Three inferences fall out. Stablecoin activity dropped in line with DeFi activity - a direct consequence of the lending and DEX slowdown rather than an independent signal. Native token activity actually grew in quantity terms, suggesting non-DeFi uses have been expanding quietly even as the financial intermediation economy contracted. And the Fisher index is doing its job: weighing native growth against bridged and stablecoin declines, it produces a net 25% real decline, meaningfully smaller than the 60% nominal drop that token price movements alone would imply.
Understanding the Recent Contraction
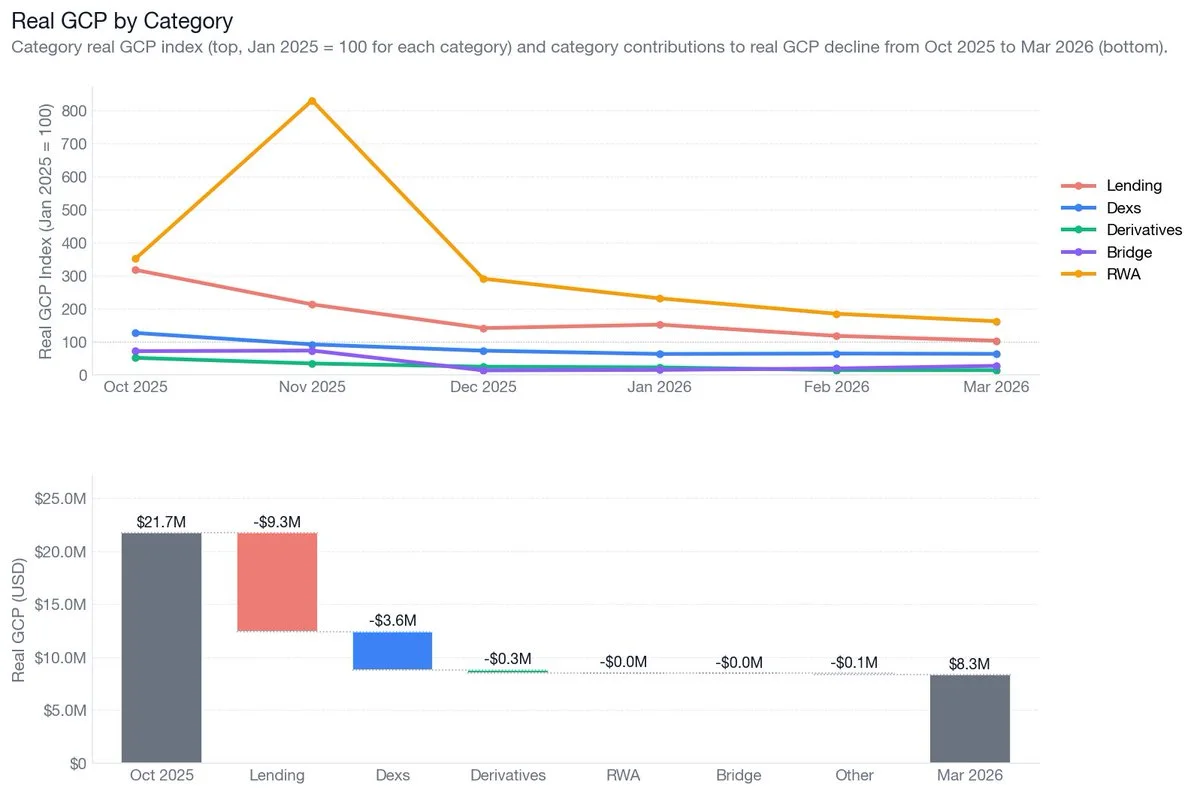
GCP Article Asset 04 - Understanding Recent Contraction
Top: category-level real GCP indices (log scale, Jan 2025 = 100). Bottom: Tornqvist-weighted contributions of each category to total real GCP growth. Both panels cover October 2025 to March 2026.
The Avalanche C-Chain economy is largely a financial intermediation economy. Lending and DEXs together account for well over 80% of total protocol revenues since Jan 2025, and even higher in recent history, and they drive the vast majority of the decline from the October 2025 peak.
Lending (e.g., Benqi, Aave, Euler, Silo) represents the largest source of decline. When collateral token values fall, borrowing capacity shrinks mechanically. The category's real GCP index fell by 68%. DEXs (e.g., Blackhole, Pharaoh, Trader Joe, Uniswap, Pangolin) are the second-largest contributor, with real swap volumes roughly halving from the October peak. Derivatives and bridges both declined sharply but started from smaller bases, contributing modestly in absolute terms.
RWA stands apart. Real-world asset protocols remained structurally elevated throughout the period, increasing by more than 7x in November 2025 from the January 2025 base (driven by BlackRock BUIDL). RWAs in March 2026 still stand roughly 1.6x the January 2025 base even as the rest of the economy contracted. The early evidence suggests that for the Avalanche economy to build more resilient GCP, expanding use cases whose revenue sources are independent of token price cycles - such as RWAs, prediction markets, payments, and enterprise applications - would meaningfully reduce sensitivity to crypto market conditions.
Looking at the Long Run
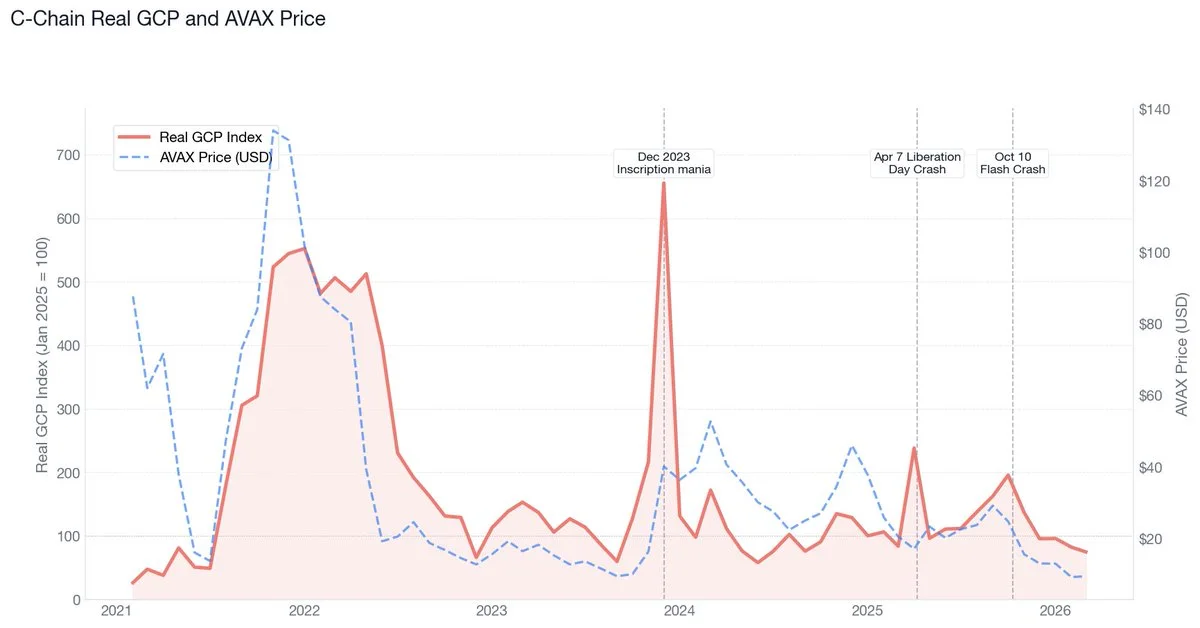
GCP Article Asset 05 - Looking at the Long Run
Real GCP Index (pink, left axis) and AVAX Price (blue dashed, right axis) from February 2021 to March 2026.
Zooming out to the full history since February 2021, several major cycles are visible.
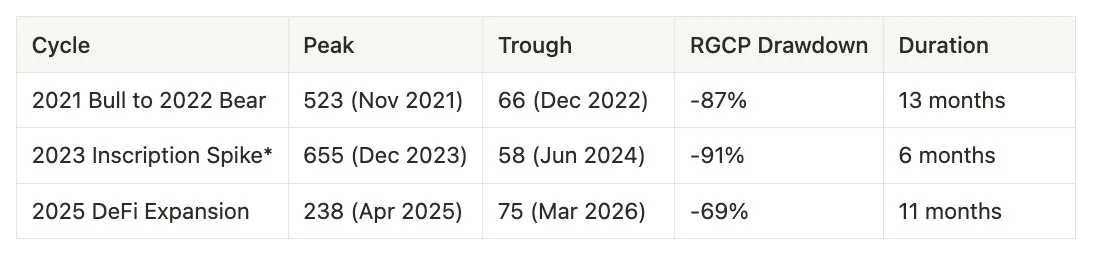
GCP Article Asset 06 - Zooming Out to Full History
The December 2023 spike was driven by Avalanche inscription activity - gas fees alone accounted for over 75% of nominal GCP that month. The subsequent crash to 58 in June 2024 is the unwinding of a short-lived surge, not a sustained economic contraction.
The 2021 bull-to-bear decline was the most severe in percentage terms (-87%). The current cycle (-69% from the April 2025 peak) is the most moderate of the three, suggesting the economy's productive base has become somewhat more resilient. More telling is the trajectory of the troughs: the March 2026 real index of 75, if it proves to be a trough, is higher than both prior cycle lows, suggesting the Avalanche economy retains meaningful real economic activity even in deep downturns.
One structural change worth watching: the active token basket has shrunk from 227 tokens in January 2025 to 102 in March 2026, a 55% reduction. This long-tail thinning suggests a consolidation over active assets. It remains uncertain whether this is a permanent structural change or a transitory one.
Conclusion
GCP provides something the blockchain industry has lacked: a methodologically rigorous, economy-wide measure of real economic output. By applying the same Fisher chain-weighted methodology that national statistical agencies use for real GDP, we can separate genuine changes in on-chain activity from the noise of token price volatility. That distinction matters not just for researchers, but for anyone making decisions about where to allocate capital, how to design incentives, or how to evaluate whether an ecosystem is actually growing.
For the Avalanche C-Chain specifically, the data tells a nuanced story. The 2025-2026 contraction is real, but it is less severe than nominal metrics suggest: a 25% real decline versus a 60% nominal drop from the January 2025 base. The decline is concentrated in financial intermediation, whose volumes are mechanically linked to collateral values and therefore highly sensitive to token price cycles. The Real World Assets (RWA) sector, by contrast, has remained structurally elevated throughout the contraction, demonstrating that blockchain economies can generate activity that is resilient to crypto market conditions. Expanding that kind of real-sector activity is not just an ecosystem diversification story. It is the path toward a more stable and measurable productive base.
At the Avalanche Foundation, GCP is one part of a broader effort to build better analytical infrastructure for ecosystem decision-making. Understanding the real productive capacity of the Avalanche economy - how it grows, what drives it, and where it is vulnerable - is foundational to how we think about grants design, protocol development, and long-term ecosystem health. Metrics shape incentives. Getting them right matters.
This is part of an ongoing series of research and frameworks I will be sharing over the coming months.
If there are questions about methodology, extensions you would like to see, or applications of this framework to specific protocols or use cases, I would welcome that conversation in the comments.